
Lessons from SVB: Graph Analytics For Modern Banking
The failure of Silicon Valley Bank highlights the importance of risk management in the banking industry. It also highlights the growing need for banks to use more effective methods, like graph analytics, to help proactively identify risks and effectively mitigate them.
Graph analytics platforms are critical assets that can help support modern risk management. More specifically, these platforms can provide banks with the ability to accurately identify liquidity risk, visualize the interconnectedness of risks, track risk over time, identify cross-business unit risk, create a holistic view of risk management, and identify emerging risks across business lines.
- In Summary: What happened to SVB?
- How Could Graph Analytics Have Helped SVB?
- How Banks Can Leverage Graph Analytics To Identify Risk
In Summary: What Happened To SVB?
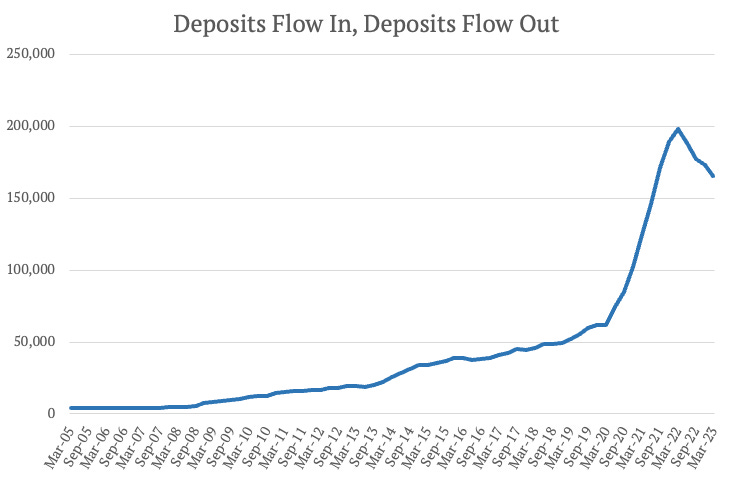
The boom in venture capital funding saw Silicon Valley Bank's deposit balances increase to $198 billion between the end of 2019 and the first quarter of 2022. The bank invested the majority of these deposits in securities, with a two-pronged strategy that sheltered some liquidity in shorter-duration available-for-sale securities and reached for a yield with a longer-duration held-to-maturity book.
However, when rates started to rise, the bank's mortgage assets suffered losses. At the end of September 2022, Silicon Valley Bank was technically insolvent due to $15.9 billion of HTM mark-to-market losses that completely subsumed the $11.8 billion of tangible common equity supporting the bank's balance sheet. Deposits started to run off faster, with a decline from $198 billion at the end of March 2022 to $173 billion at the end of December.
Silicon Valley Bank responded to the outflows and increased flexibility by selling $21 billion of available-for-sale securities to raise cash. Its crisis meant that the capital raise to cover AFS portfolio losses was pulled, leaving Silicon Valley Bank undercapitalized.
The California DFPI disclosed that as of the close of business on March 9, Silicon Valley Bank had a negative cash balance of approximately $958 million and that despite attempts to transfer collateral from various sources, it didn’t meet its “cash letter” with the Federal Reserve.
The Federal Deposit Insurance Corporation (FDIC) was then appointed as receiver, and all insured deposits have been transferred to a newly created bank, the Deposit Insurance National Bank of Santa Clara (DINB). Uninsured depositors meanwhile are left hanging. They will receive an “advance dividend” this week, with future dividend payments contingent on FDIC selling Silicon Valley Bank assets.
How Could Graph Analytics Have Helped SVB?
Graph analytics is a technique used to analyze the relationships and connections between different entities. It involves using mathematical algorithms to identify patterns and insights from complex datasets. In the context of financial institutions, graph analytics can be used to identify and manage risks by analyzing the interconnectedness between different assets and liabilities.
In the case of Silicon Valley Bank, graph analytics could have helped the bank to identify the interdependencies between its deposit base, investment portfolio, and mortgage assets. By mapping out these relationships, the bank could have identified potential areas of vulnerability and taken steps to mitigate the risks.
For example, the bank could have used graph analytics to identify how changes in interest rates could impact its mortgage assets and the overall health of its balance sheet. This would have allowed the bank to adjust its investment strategy in a timely manner, such as by reducing its exposure to longer-duration held-to-maturity securities or by increasing its liquidity reserves to protect against potential losses.
Furthermore, graph analytics could have helped the bank to identify potential sources of liquidity risk, such as the outflows of deposits, and take proactive measures to address these issues. By analyzing the interconnectedness between its various assets and liabilities, the bank could have identified the most effective strategies for managing its liquidity and maintaining its solvency.
Using Graph Analytics to Identify Risk Factors
Silicon Valley Bank - and any bank today - can use graph analytics to analyze complex networks of interconnected data and identify key risk factors.
Here are a few ways:
- Visualizing the Interconnectedness of Risks: One of the key benefits of graph analytics is its ability to visualize the interconnectedness of complex systems. Banks can use graph analytics to create a visual representation of the relationships between various risk factors, such as interest rate fluctuations, mortgage assets, and liquidity risk. By analyzing this model, banks can potentially identify areas of vulnerability and take proactive measures to mitigate risk. For example, banks can identify mortgage assets that were highly dependent on interest rate fluctuations and proactively hedge those assets to minimize potential mark-to-market losses.
- Tracking Risk Over Time: Graph analytics can also help banks track risk over time. By creating a graph model that captures the relationships between various data points, such as changes in interest rates and changes in mortgage asset values, the bank could have identified early warning signs of potential losses. For example, the bank could have identified a pattern of increasing mark-to-market losses on certain mortgage assets and taken proactive measures to reduce exposure to those assets.
- Identifying Cross-Business Unit Risk: Graph analytics could have been used by Silicon Valley Bank to identify risk factors that affect multiple business units or operations. For example, the bank could have created a graph model that captures relationships between credit risk, market risk, liquidity risk, and operational risk. By analyzing this model, the bank could have identified areas where different business units were exposed to similar risks and taken proactive measures to mitigate those risks.
- Creating a Holistic View of Risk Management: Graph analytics could have also helped the bank create a more holistic view of its risk management strategy. By creating a graph model that captures relationships between different types of risks, the bank could have identified potential areas of overlap and synergy. For example, the bank could have used graph analytics to identify how changes in interest rates could impact both credit risk and liquidity risk. By proactively managing these risks, the bank could have created a more comprehensive risk management strategy that takes into account the interconnectedness of different types of risks.
- Identifying Emerging Risks Across Business Lines: Graph analytics could have also helped Silicon Valley Bank identify emerging risks across different business lines or operations. By creating a graph model that captures relationships between various data points, the bank could have identified potential areas of concern before they became major issues. For example, the bank could have identified emerging credit risk issues in its lending portfolio by analyzing relationships between loan performance, customer demographics, and market trends. By proactively addressing these issues, the bank could have reduced the risk of significant losses in the future.
Getting started with Graph Analytics
Learn how the combination of Process Tempo + Neo4j can provide your organization with risk management support in the form of graph analytics. Neo4j is an open-source, graph database technology that allows you to model relationships between various data points in order to uncover hidden insights. Process Tempo is a graph application platform built exclusively on top of Neo4j that makes graph data more accessible and powerful to all users throughout the business. Together, these two technologies provide the foundation for powerful risk management strategies that focus on identifying emerging risks, understanding interconnected risk factors, and creating a more holistic view of risk management.
Click here to schedule a conversation with one of our representatives and get started today!
Discover the Power of Data
Unlock insights and drive business growth with our platform
Related News
Discover the latest trends and insights in data analytics.